Colorado Lobbyist Data Analysis
Tools Used: Python, Pandas, NumPy, Matplotlib, Excel
Skills Showcased: Data Extraction, Cleaning, EDA, Visualization, Automation
Web Scraping to PowerBI
This section showcases my portfolio and project explanations.


Project Overview
This project focuses on identifying irregular patterns in public lobbying expenditure data from the State of Colorado. Using a government API, I built a complete data pipeline using Python—from extraction and cleaning to exploratory analysis and visualization.


Project Details
Extracted the data from the Colorado government open data website using Python (1_download_data.py)
Cleaned and processed the dataset to normalize formats and remove incomplete records (3_clean_data.py)
Performed basic analysis and created visualizations using Matplotlib (4_analysis_and_graphs.py)
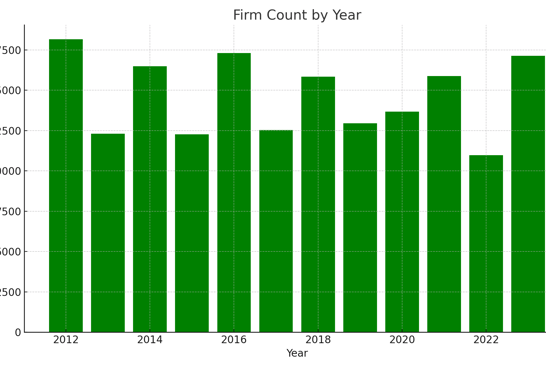
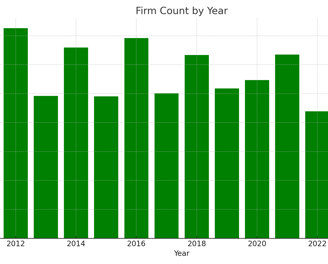
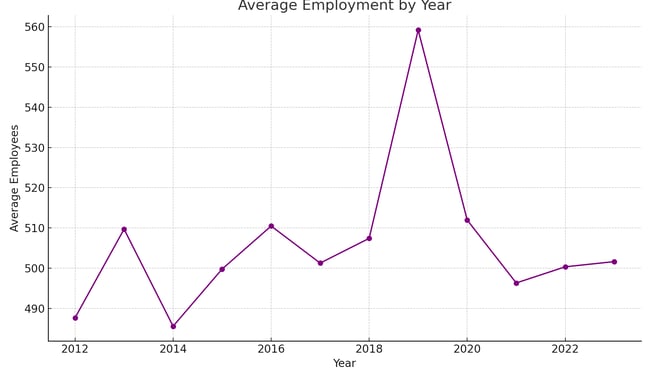
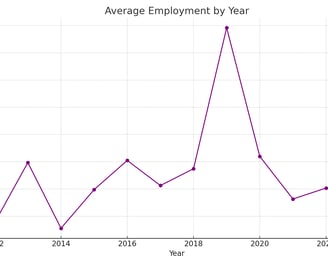
Results include: total expenditure trends, average employment trends, and firm participation patterns
Summary of the results from output file.
Highest Spending Year: 2023 with $22,622,885.23
Lowest Spending Year: 2022 with $12,482,512.40
Highest Average Employment: 2019 with 559.15 employees
Lowest Average Employment: 2014 with 485.63 employees
Most Firms Reported: 2012 with 18,154 firms
Fewest Firms Reported: 2022 with 10,983 firm
Once done I wrote python code to upload to MongoDb
This pipleine is not end to en dbuilt due to available resource but could be automated to reflect updated data
Following are the Images generated from Matplotlib
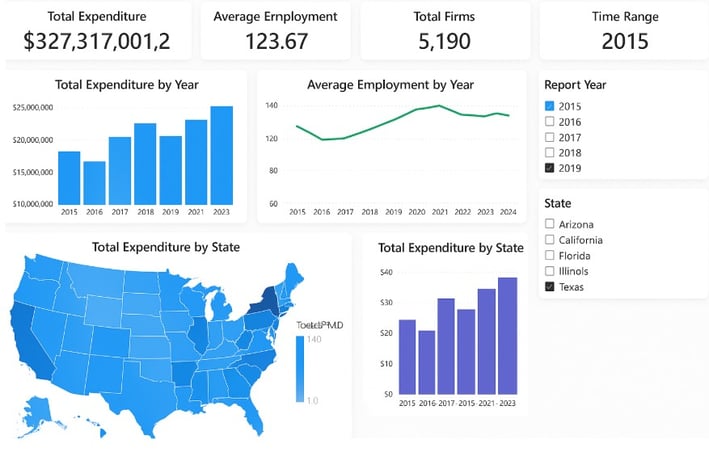
PowerBI
I then Imported the MongoDb data into PowerBi and Created custom measures , tables and calculations to create a dashboard as the end product
Get in Touch with Us
We would love to hear from you regarding your project. Please reach out with any questions or feedback about our portfolio.
Contact
1234567890
Support
contact@portfolioexample.com
Portfolio
Showcasing my skills in data analysis online.
Contact
Connect
thoranprudhvi@gmail.com
+1 7207574984
© 2025. All rights reserved.